sOUTHERN oREGON'S mARKET IS WAKING UP
FOUR YEARS ON PAUSE, AND WHY THAT'S OVER
I've been doing this for 32 years, and I don't say this lightly: 2022 through 2025 felt like a real estate recession. Not the headline kind, with dramatic price crashes and panic — a quieter, slower one. It didn't start out that way. In 2020 and 2021, we were crazy busy, selling tons of property. But even then, something else was already happening underneath the surface: people were putting the bigger decisions in their lives on hold.
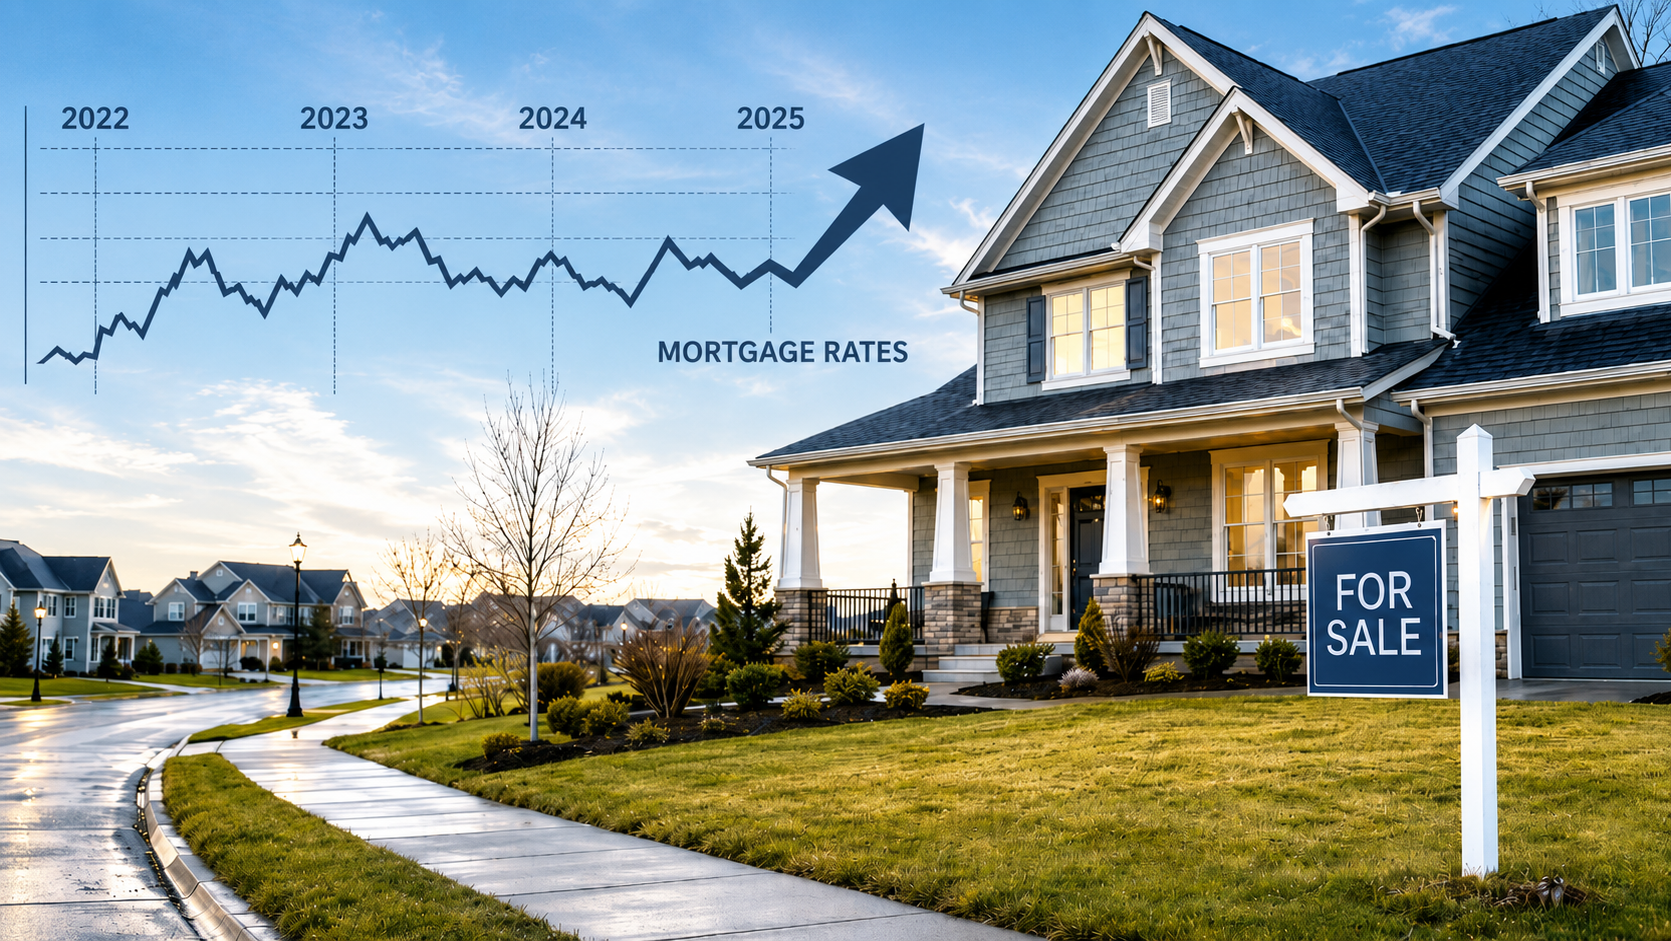
Think about the sequence. COVID hit in 2020, and even amid all that early buying and selling activity, people started pressing pause on the parts of life that felt too big to navigate through uncertainty. Then rock-bottom interest rates arrived right as things reopened, and instead of freeing people up, those rates trapped sellers in place — nobody wanted to give up a 3% mortgage, so inventory dried up and buyers had almost nothing to choose from. Then, from roughly 2022 through 2025, rates climbed fast, and the trap reset from the other direction: buyers got priced out and sat on the sidelines, while sellers who might have moved anyway now faced both a high rate on their next home and a shrinking buyer pool. That four-year stretch is when it actually started to feel like a recession. Layer on an election year, tariff uncertainty, and this spring's conflict with Iran, and you had every reason in the world for people to keep waiting.
And yet. That is not what I am seeing right now.
Ashland closed June 2026 with pending sales up 34% over June 2025. That is not a rounding error — that is a lot of people deciding, all at once, that they are done waiting. My read on why is simple: six years is a long time to put the bigger decisions in your life on hold. People are getting older, kids are growing up, jobs are changing, retirement clocks are ticking. At some point "we'll wait for things to settle down" stops being a strategy and starts being a way of losing years you don't get back. I think a critical mass of buyers and sellers hit that point this year, together, regardless of what the news cycle was doing. Not everyone is feeling this shift equally — some of my colleagues are still seeing a slower pace — but in my own transactions and in the data I'm watching, the energy is real, and it is new.
Here's what the numbers from our local MLS actually show, market by market.
Where ASHLAND Actually StandS
Ashland's last twelve months split into two very different chapters, and understanding both is what tells you where we are now. Last summer into fall, inventory was healthy — active listings sat around 185 homes. Then, heading into winter, things tightened hard. By January, active listings had dropped to roughly 110, one of the leanest points I've seen in a while, and days on market stretched out to nearly 140 days as fewer buyers were shopping and fewer sellers were testing the market.
Then, right after January 1, the phones started ringing. That's often the first sign of a shift — before it shows up in the closed numbers, it shows up in who's calling. Inventory climbed steadily back up through spring, new listings and closed sales both rebounded sharply, and June came in as one of the strongest months of the entire year — pending sales up 34% year-over-year, sold price volume near its highest point of the trailing twelve months, and homes still selling close to asking price, with the sold-to-list ratio holding around 96%.
That last part matters most. This isn't a market where sellers are panicking and slashing prices to get deals done. It's a market where real demand showed up, buyers and sellers found each other again, and pricing held its ground the whole time.
WHERE EAST MEDFORD ACTUALLy STANDS
East Medford has been running its own version of this story, just at a faster, steadier clip all year. This market never slowed down as dramatically as Ashland's — absorption rate held in the 2.6 to 4 month range essentially the entire twelve months, which is seller-favorable territory almost without exception. Inventory followed the same seasonal dip-and-rebound shape as Ashland, bottoming out near 163 active listings in January before climbing to its highest point of the year — around 225 to 230 homes — by late spring and into June. That gives buyers real options right now, without the market losing its edge. And the sold-to-list ratio, after softening to around 93-94% over the winter, climbed back to roughly 97% by spring and has held there — a strong signal that homes are consistently closing right around asking price. Prices have moved up steadily most of the year too, with median sold prices climbing from the low $460,000s toward the $500,000s by late spring.
What This Means If You’re Selling
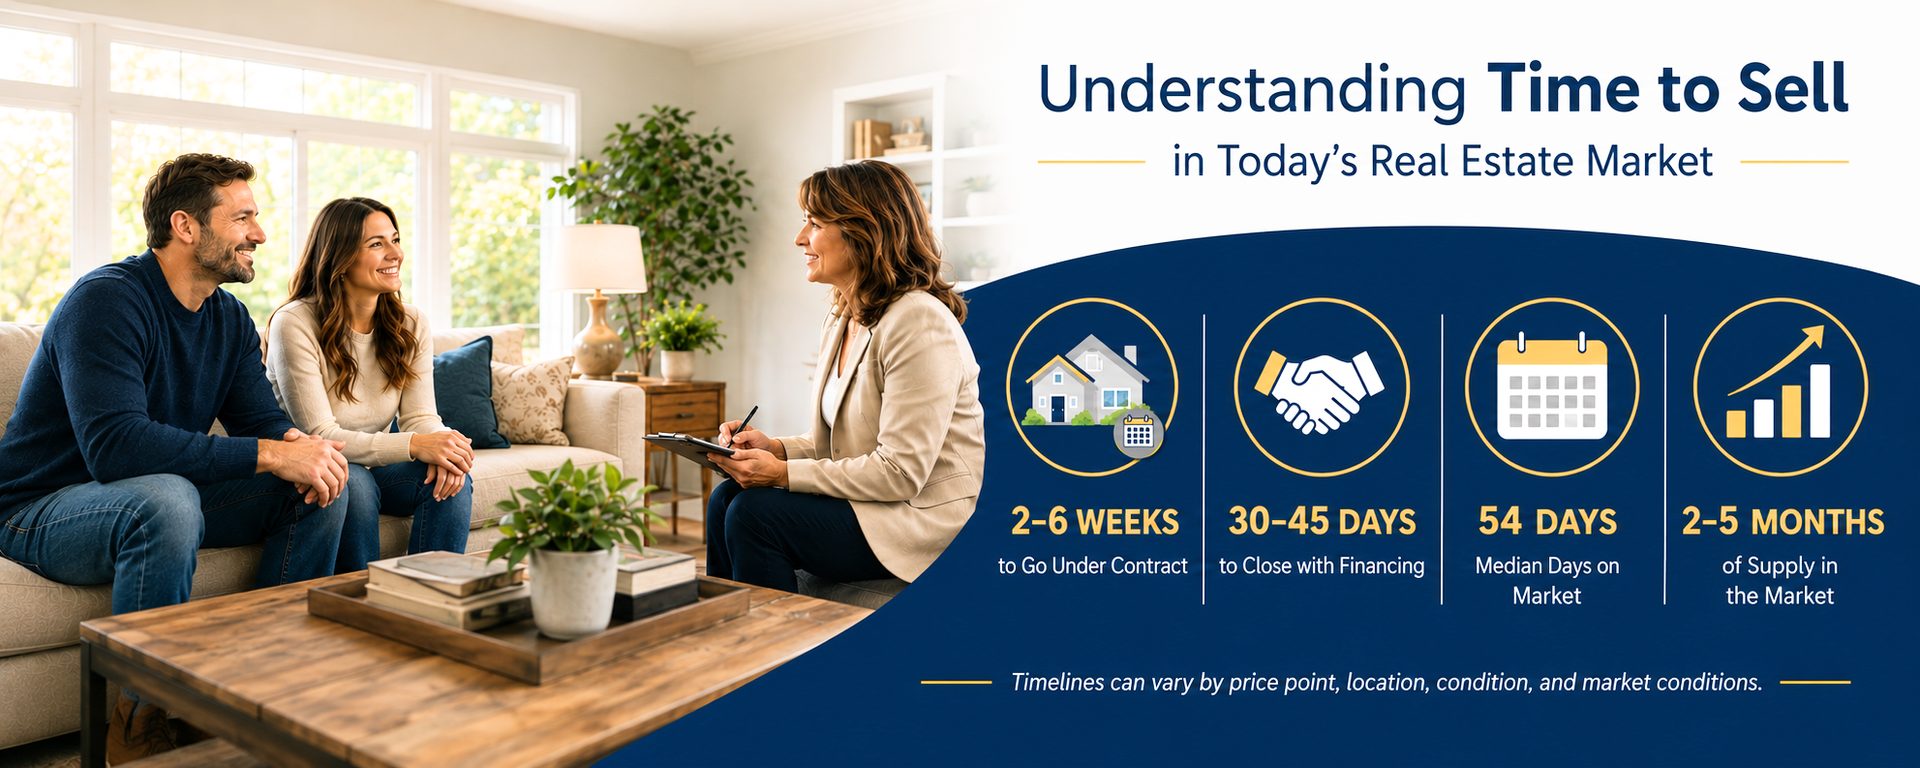
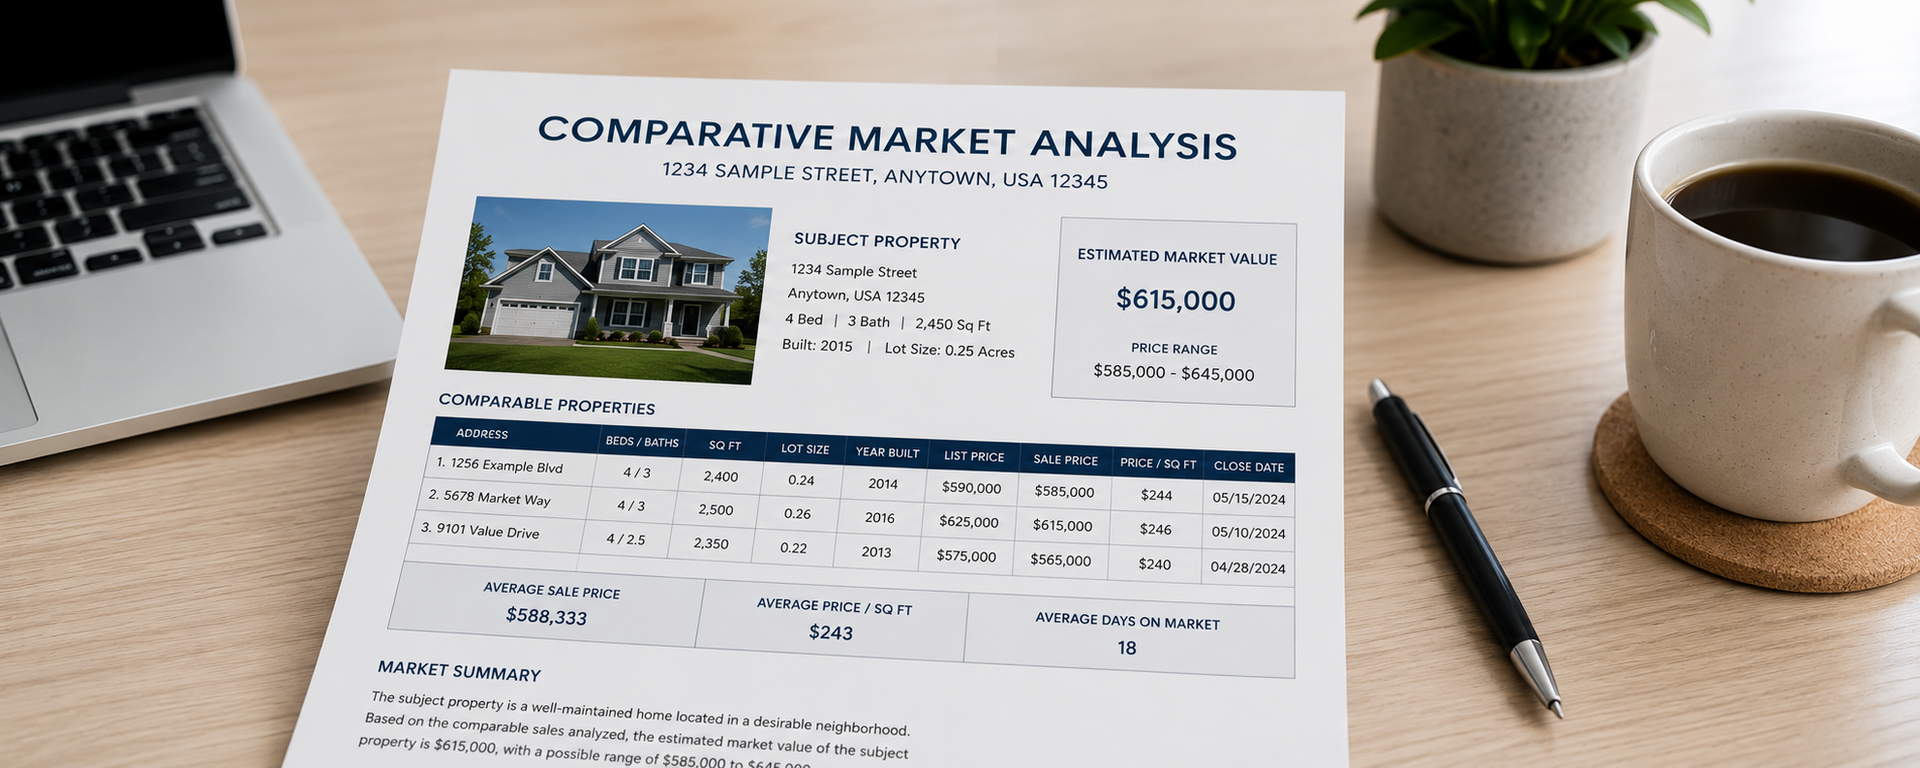
If you have been waiting for "the right time," this is worth paying attention to. Rising pending sales and steady sold-to-list ratios are encouraging signs, but they are not a blank check. The homes moving quickly right now are priced to today's buyer psychology, not to what a similar home sold for at the peak of a previous cycle. Buyers who spent the last four years watching and waiting are not impulsive — they are informed, and they notice extended market time. A sharp, current comparative market analysis matters more now than it did a few years ago, when almost anything could sell regardless of price.
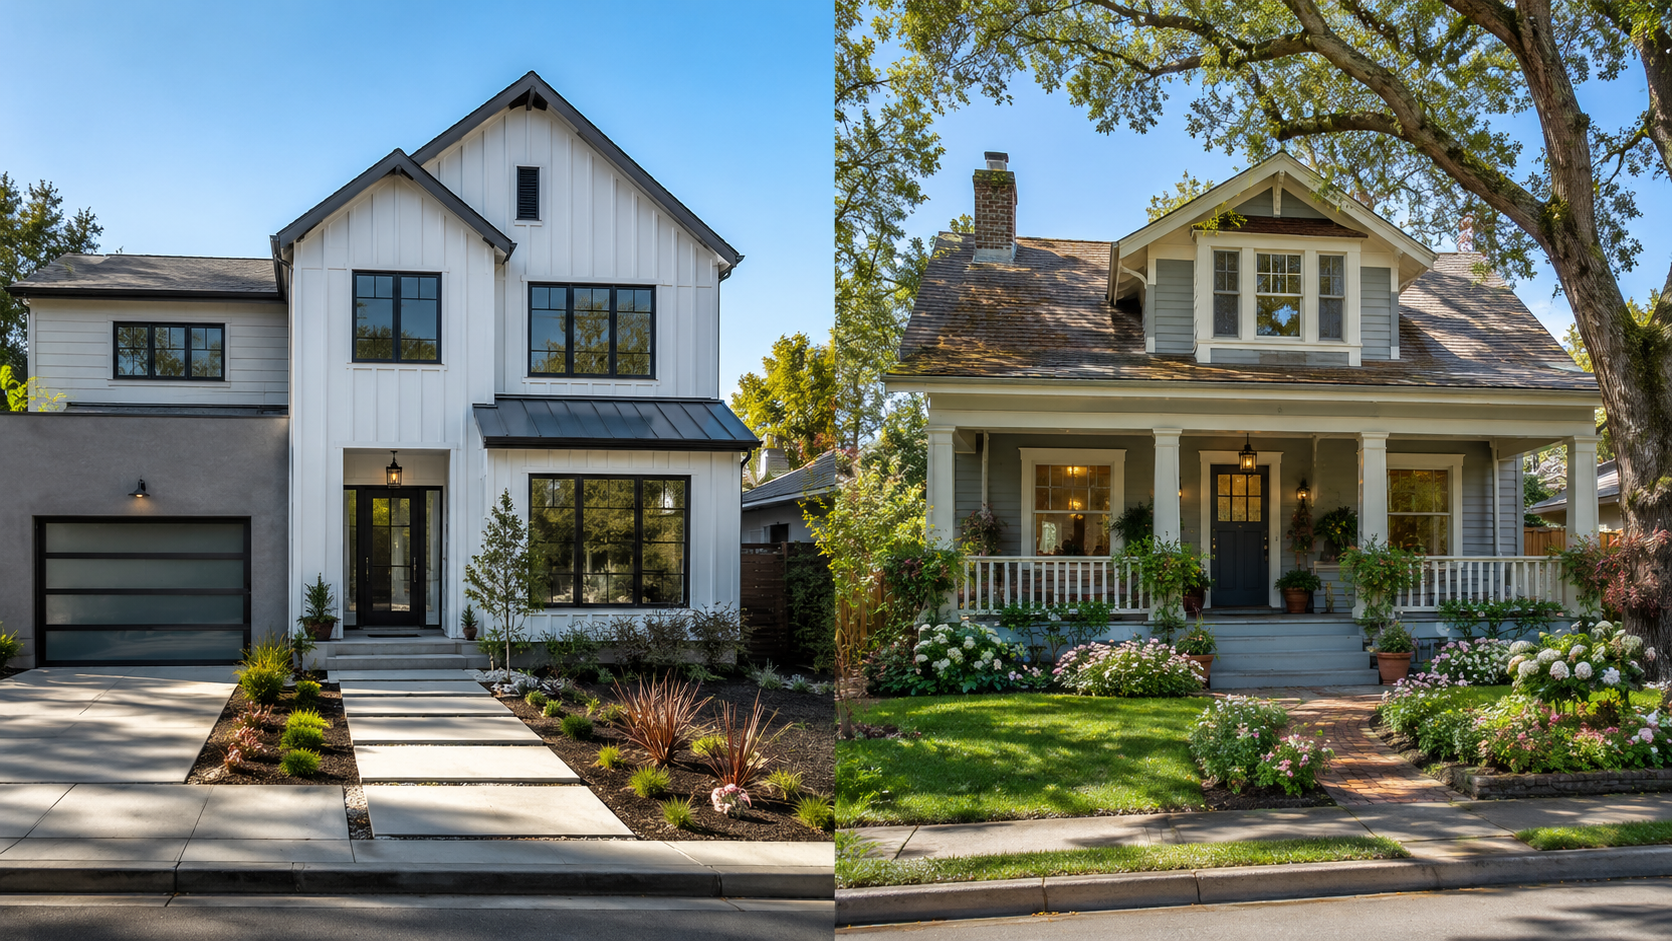
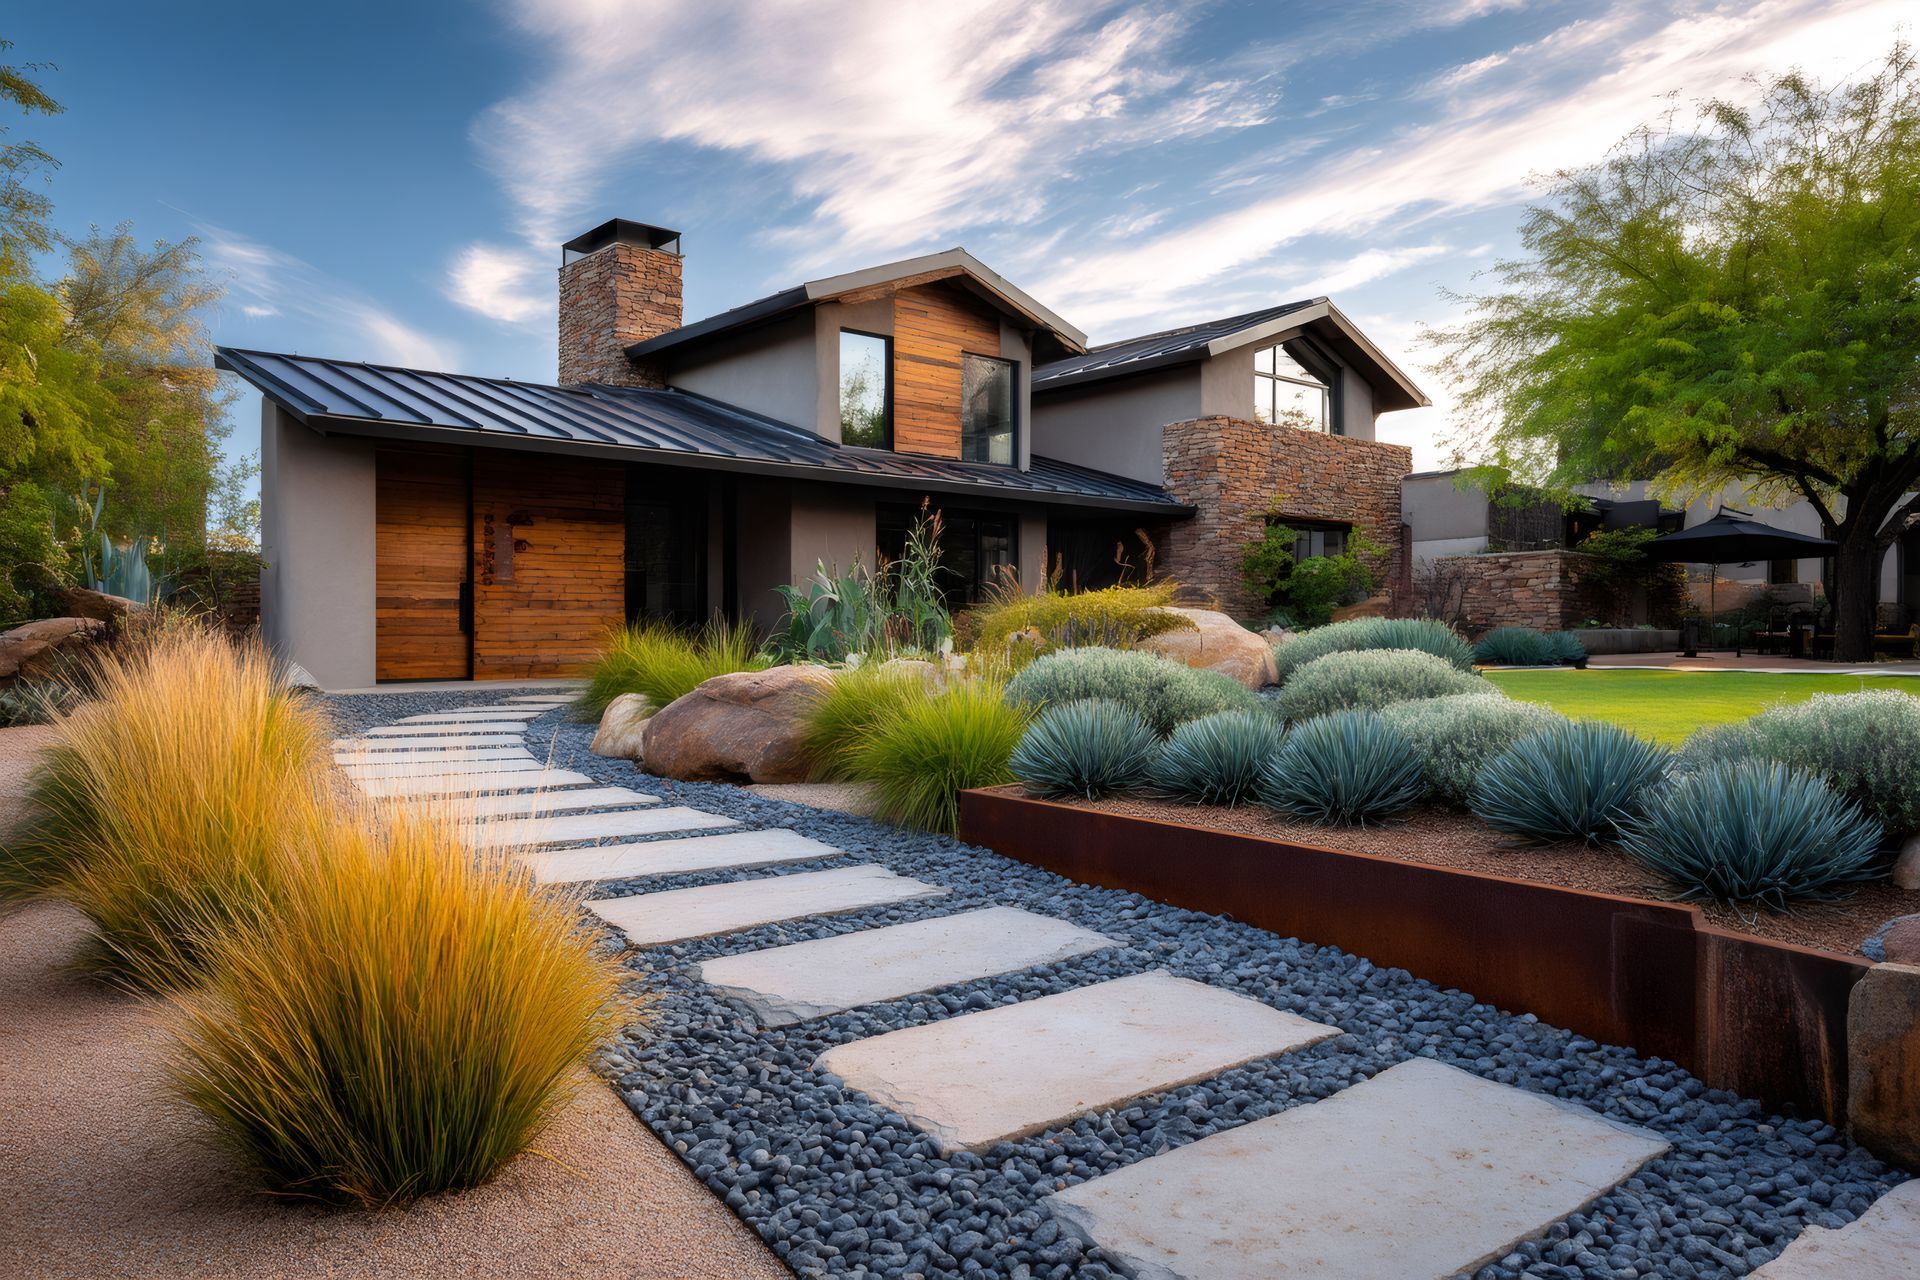
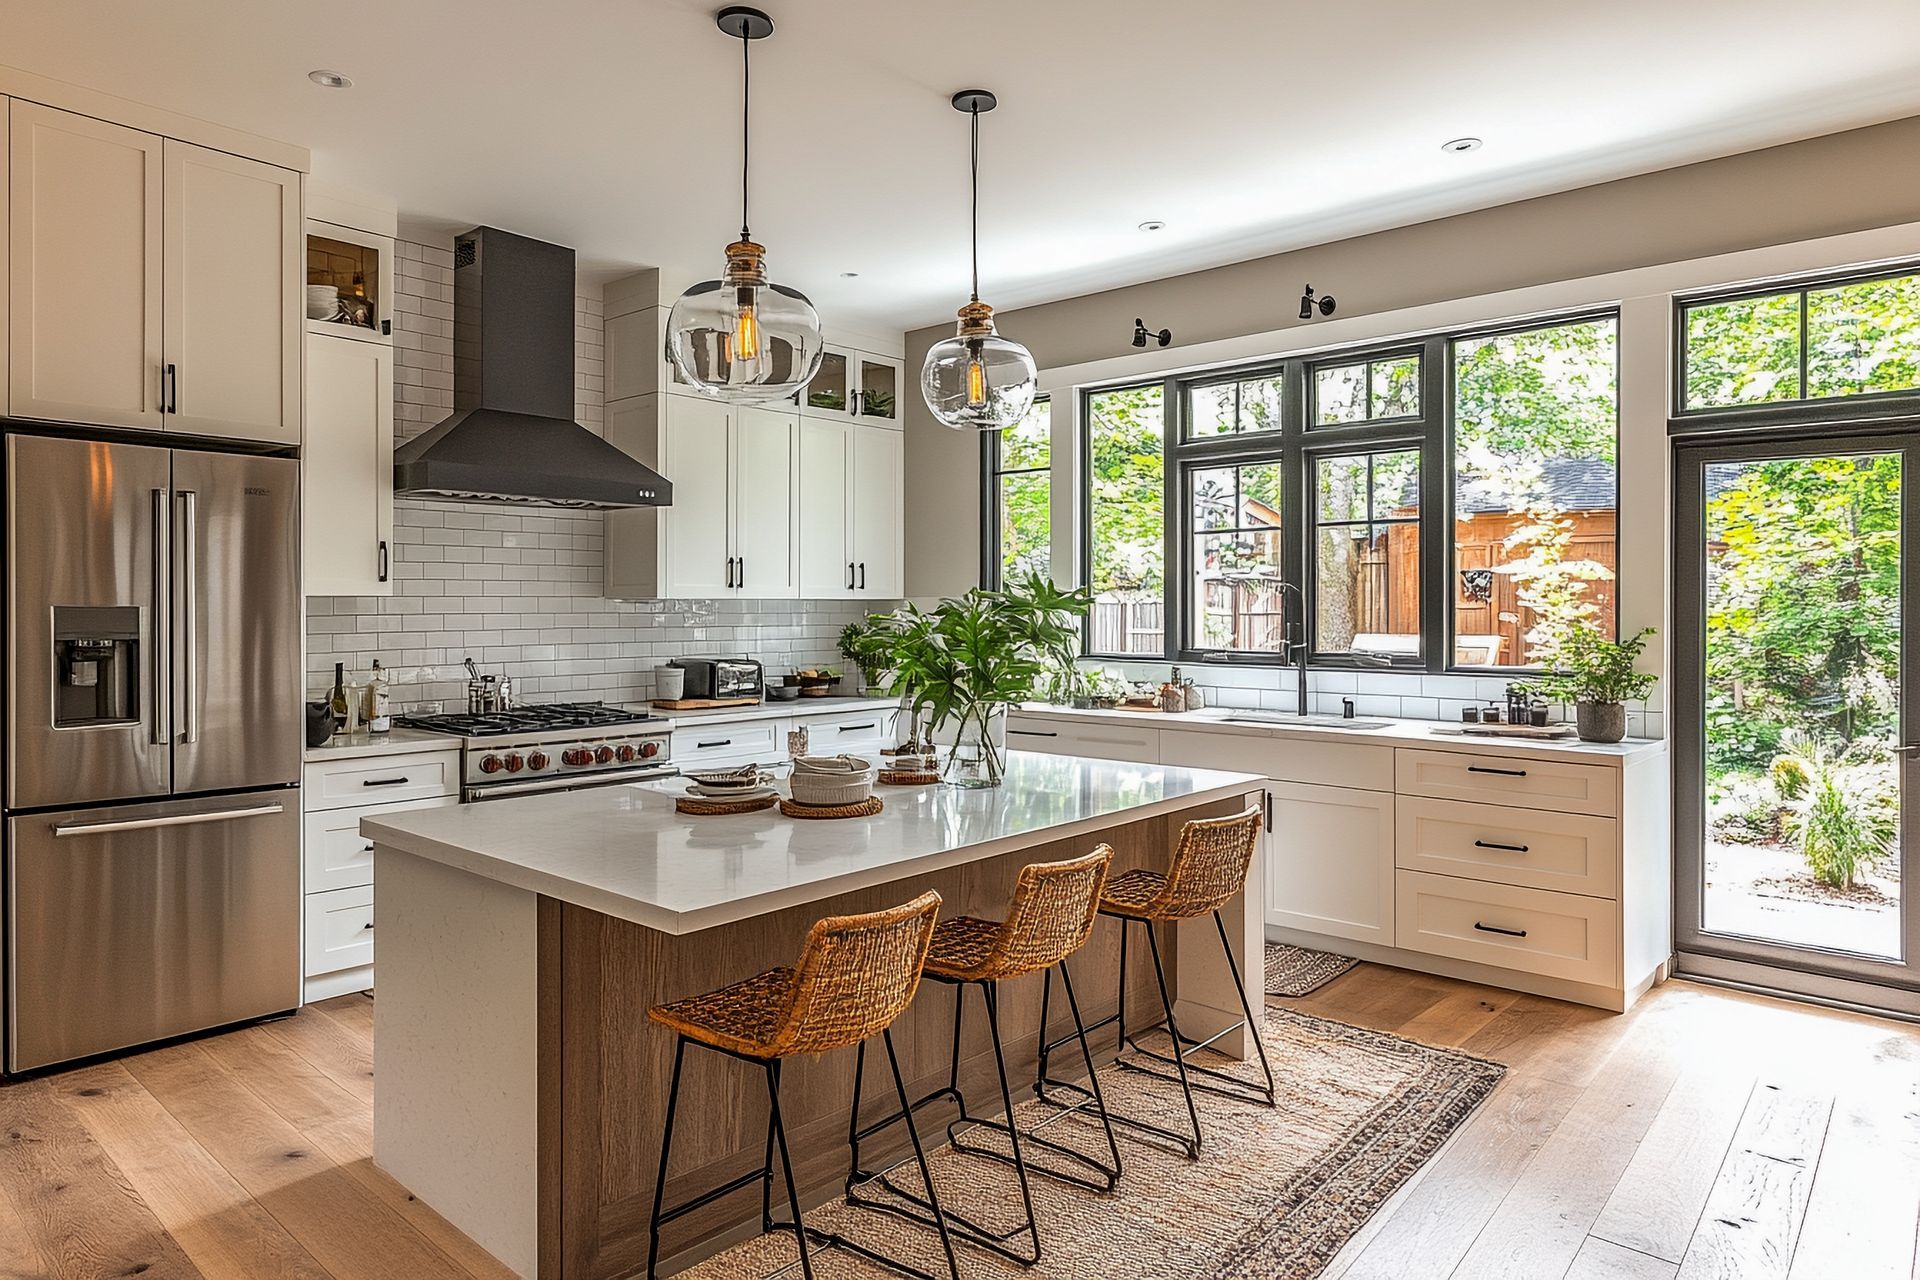
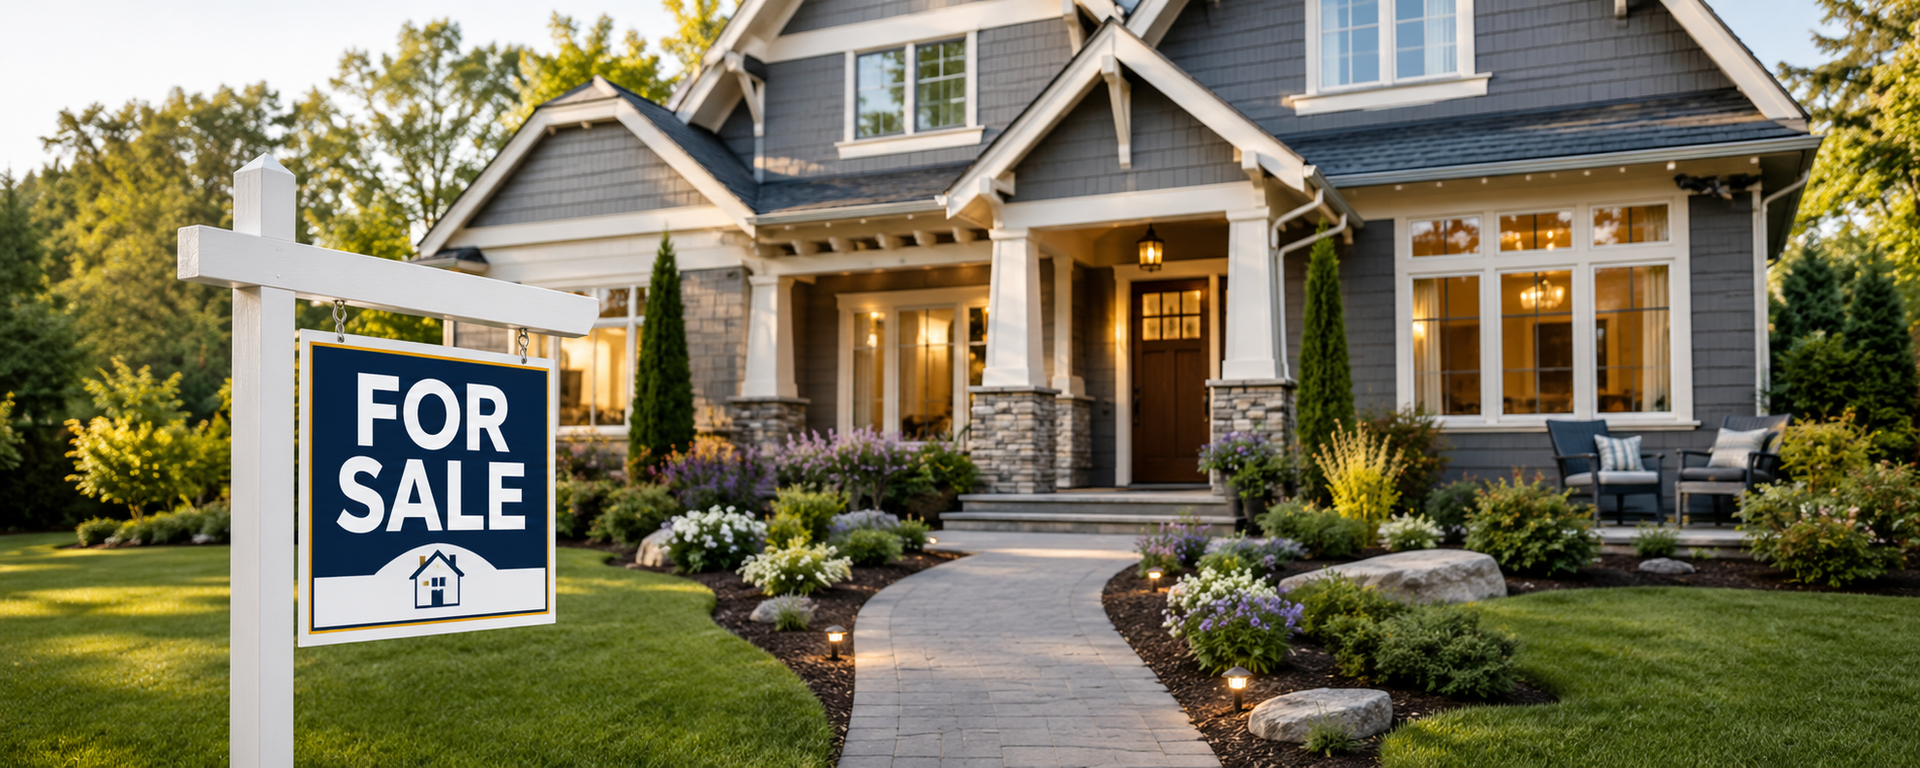
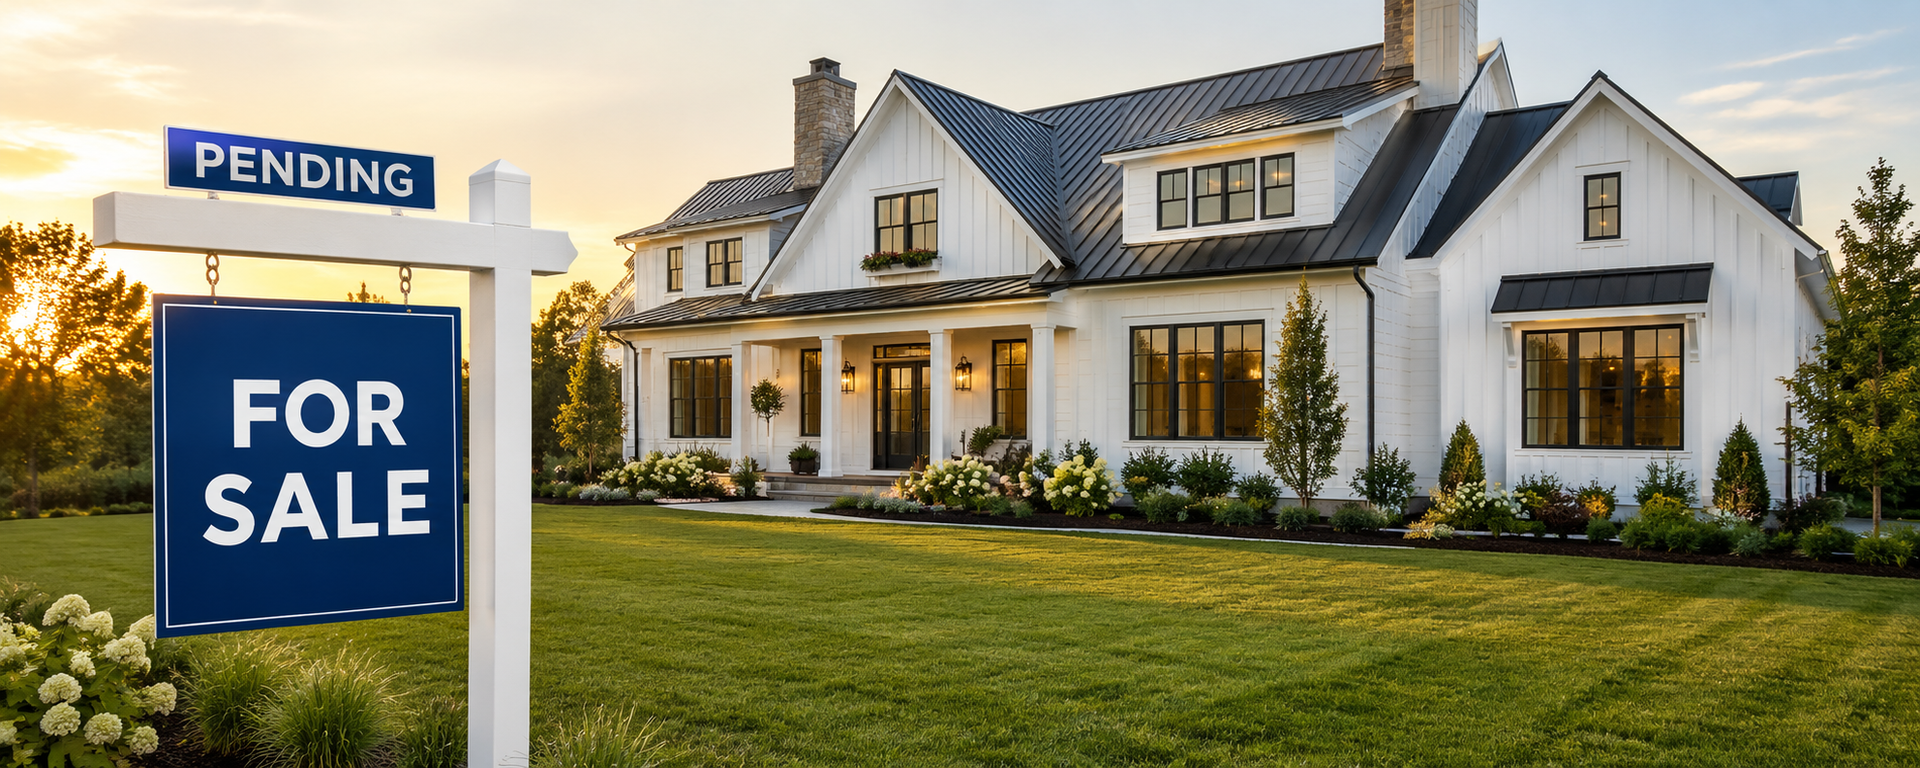
Presentation matters just as much. Buyers who have waited this long are also selective. The homes creating the strongest response are the ones that look polished from the very first photo.
What This Means If You’re Buying
Don't let a statistic like "34% more pending sales" scare you out of the search. Let it sharpen your preparation instead. Before you start touring seriously, make sure your financing is truly ready — know the difference between being pre-qualified and being fully prepared to write an offer. Understand your top price, your comfort zone, and your walk-away point before you fall in love with a home. If you have been sitting on the sidelines for the last several years waiting for rates or the news cycle to feel more settled, it's worth asking yourself honestly whether that day is actually coming, or whether it's time to move forward on your own timeline instead. This market is rewarding buyers who are organized, informed, and decisive — not reckless, just prepared.
The Takeaway
I don't think what's happening right now is a fluke, and I don't think it's hype. After six years of people pausing their lives — for a pandemic, for rates that trapped them in place, for an election, for global uncertainty — a lot of people simply decided that time was running out to wait any longer. That is what fresh energy in a market actually looks like: not speculation, but people getting on with the next chapter of their lives. Ashland and East Medford are each telling their own version of that story right now, and the underlying data backs it up. If you are weighing a move in either direction, I am always happy to walk through exactly what your specific street, price point, or timeline looks like. County-wide numbers are a starting point. The real answers come from looking closely at your situation.
Data source: Southern Oregon MLS (FlexMLS), trailing 12-month market summaries for Ashland (97520) and East Medford (97504), through June 2026.
Call or text me anytime with your questions. I am always happy to help.

When details matter, experience shows.
Partner with Patie Millen for clear guidance, proactive problem-solving, and a well-managed real estate experience.
Click here to READ OUR REVIEWS